Production-ready observability platform built on AWS EC2 using Prometheus, Grafana, Loki, Grafana Alloy, Python Flask, and Slack notifications for real-time monitoring, log aggregation, visualization, and alerting.
Architecture
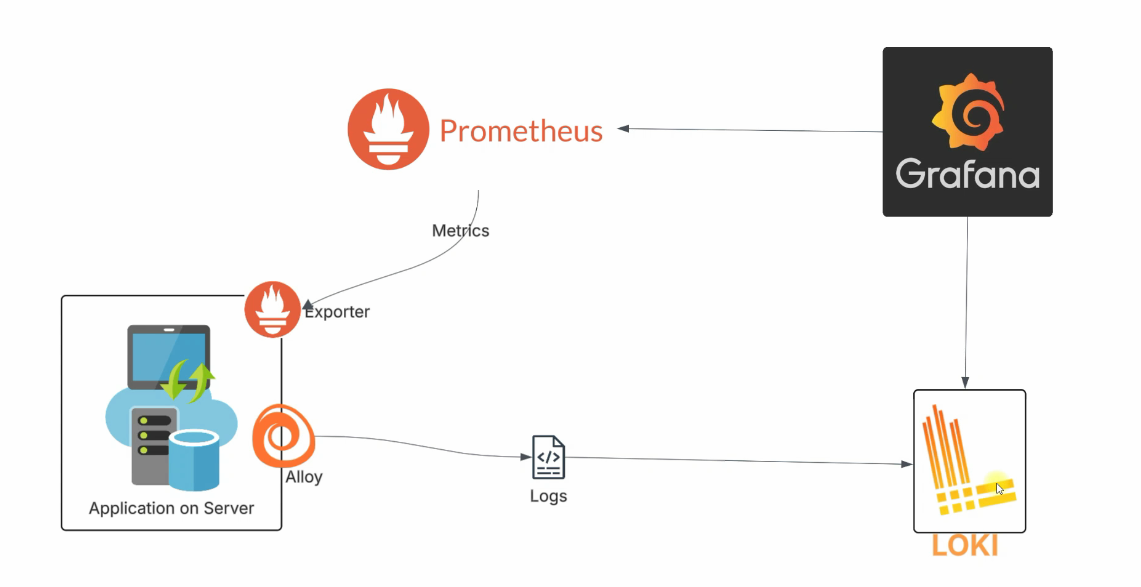
Architecture Highlights
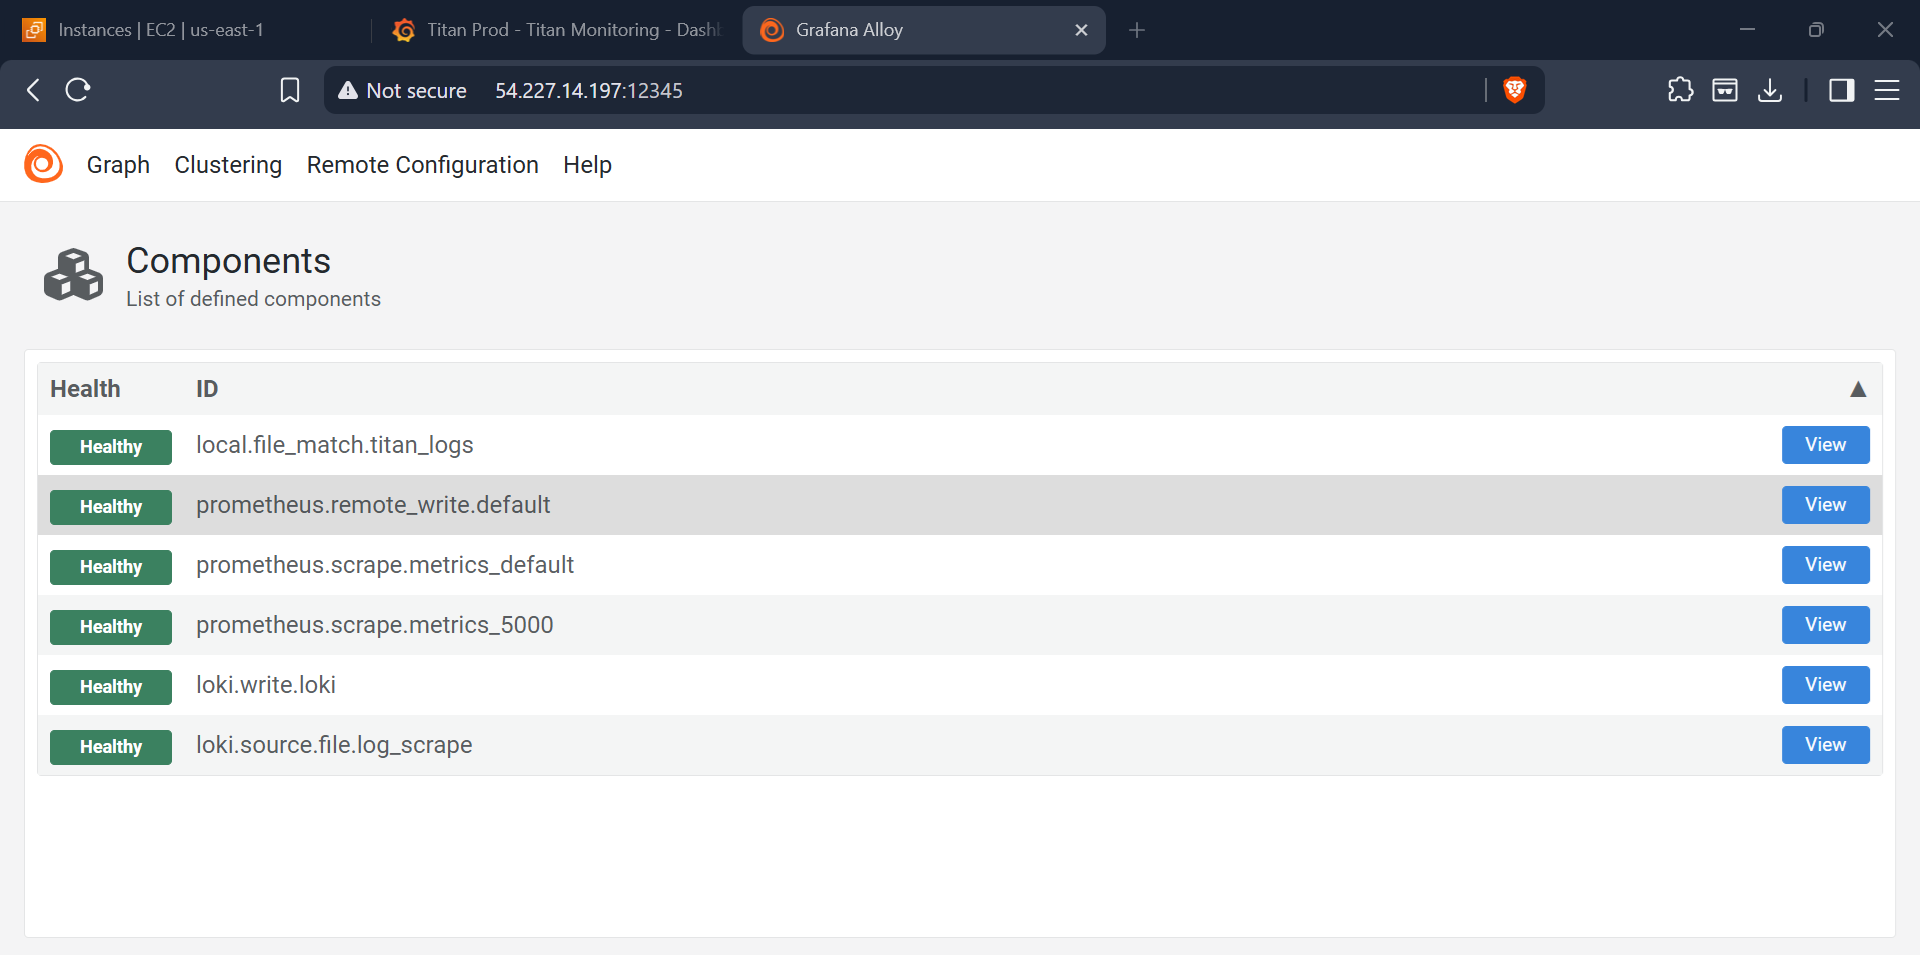
Grafana Alloy collects application and system telemetry.
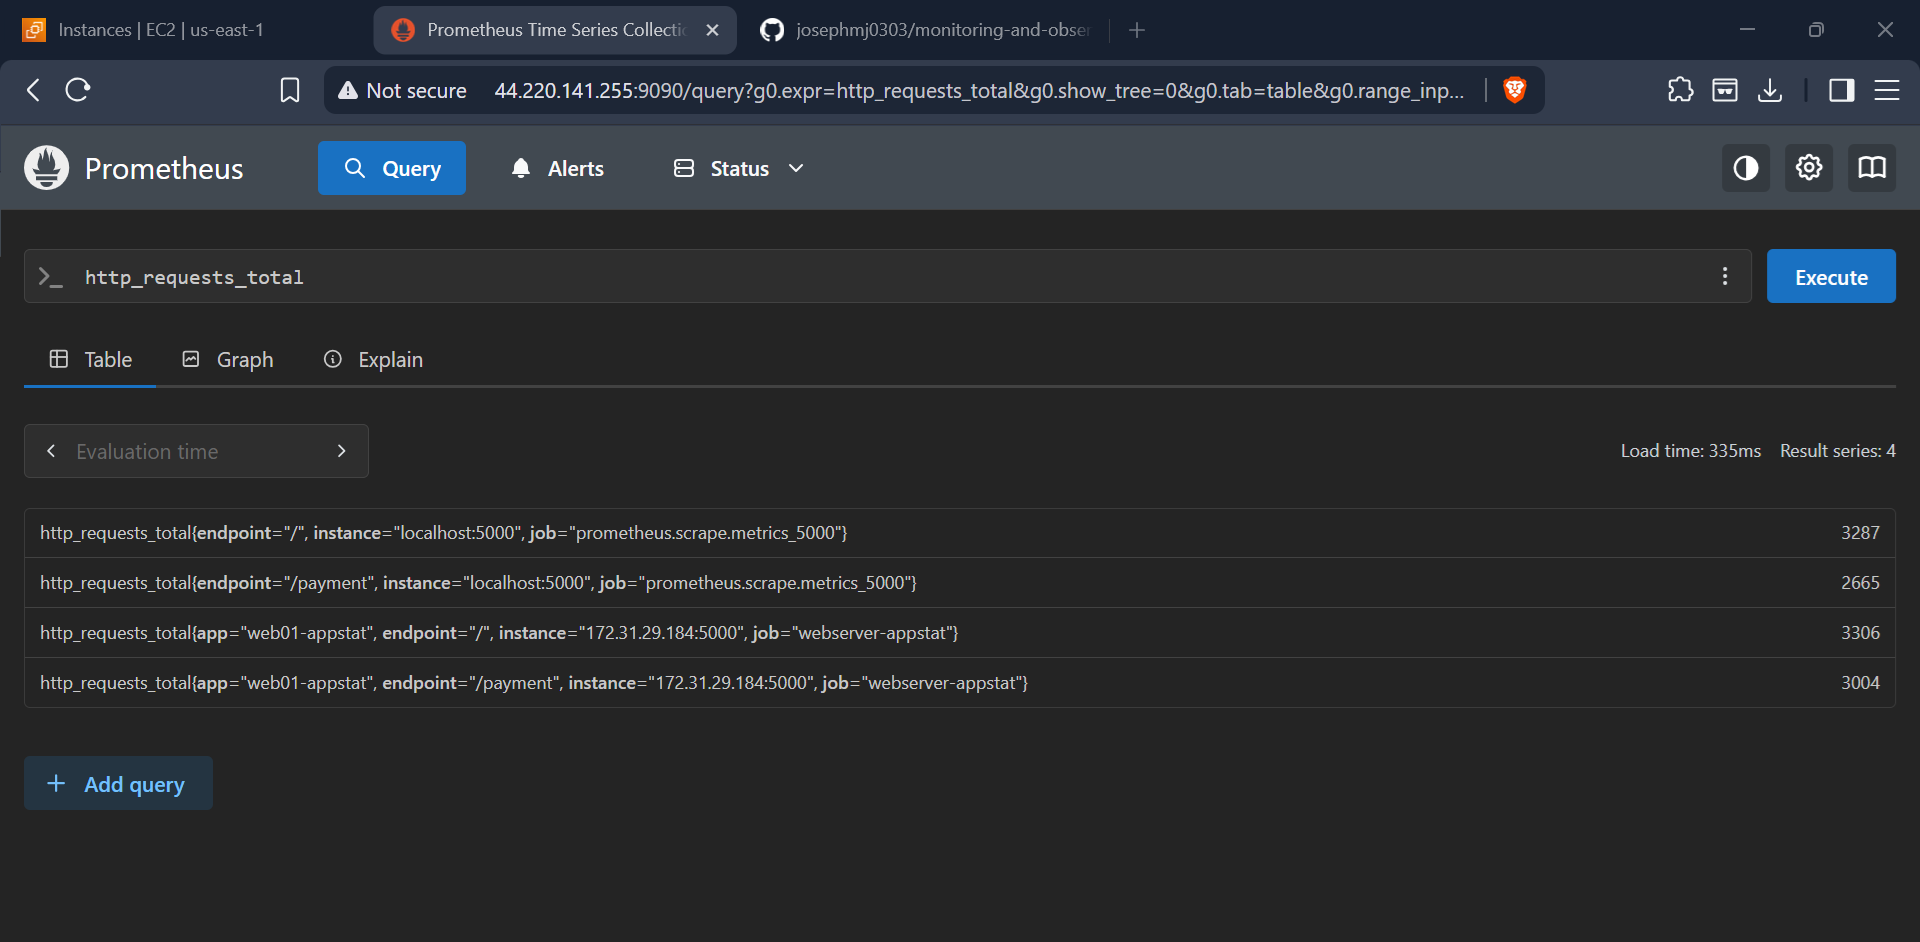
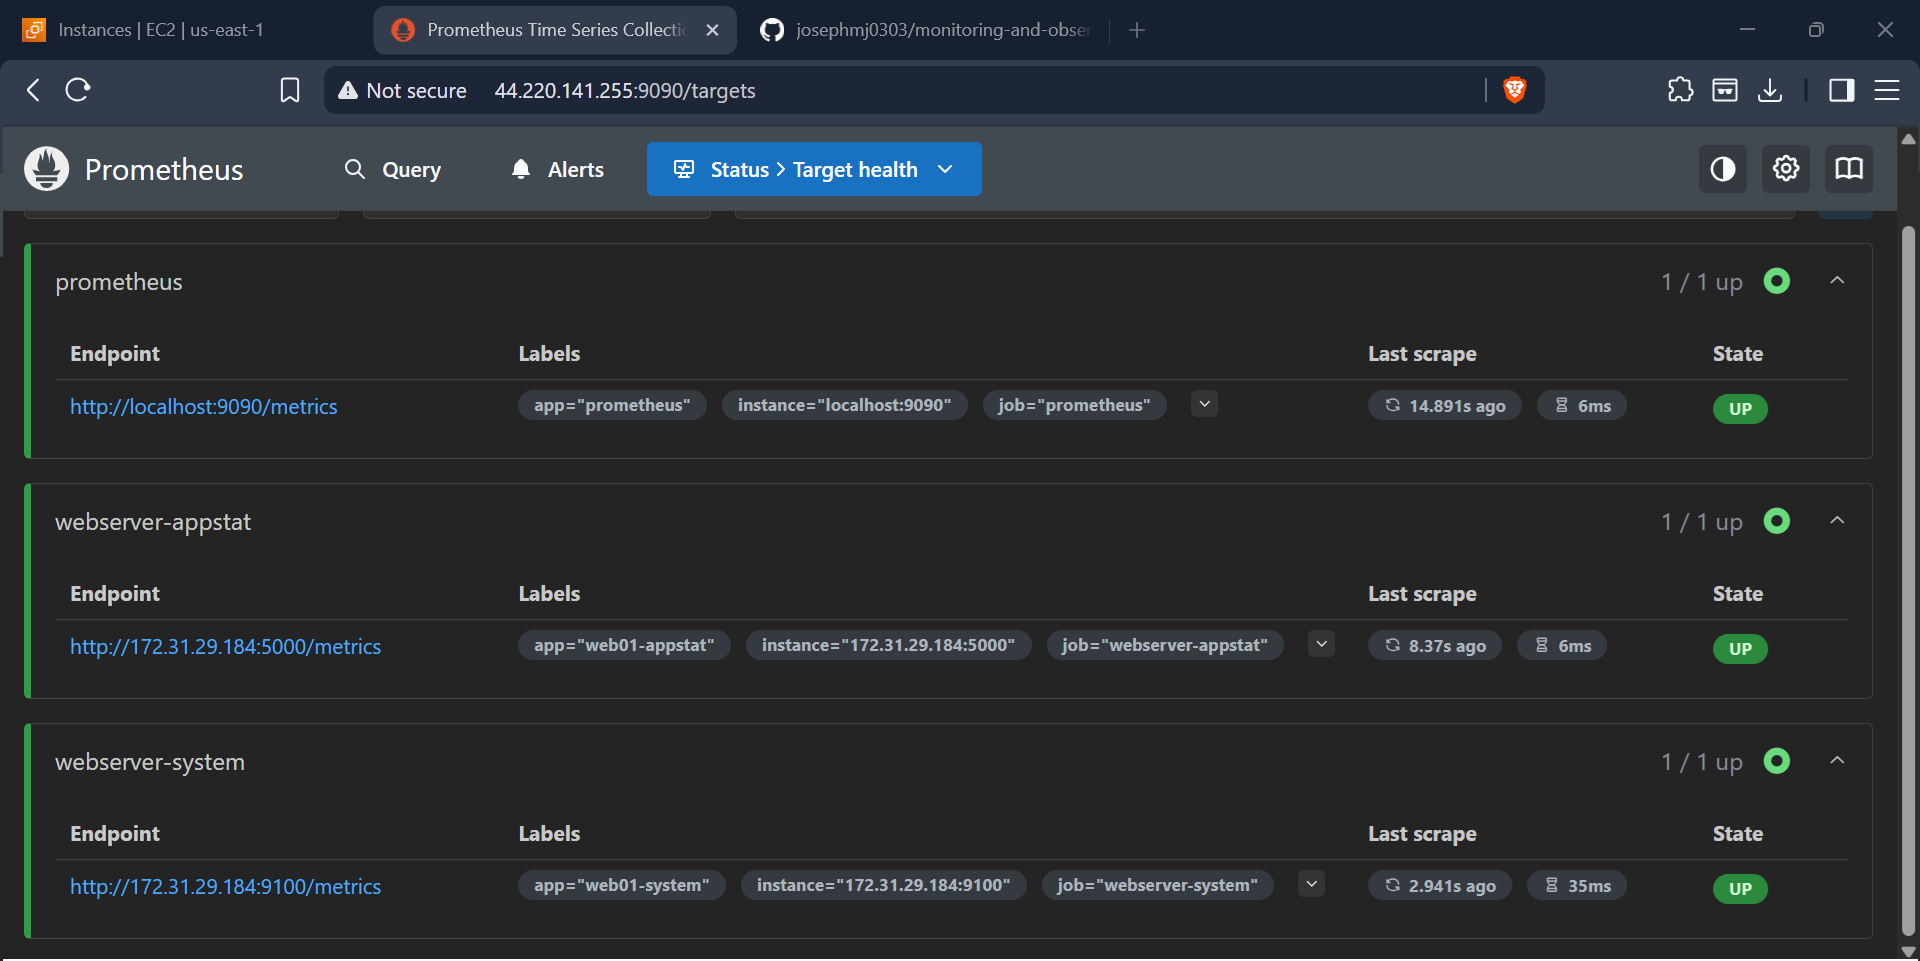
Prometheus stores and queries time-series metrics.
Loki centralizes and indexes application logs.
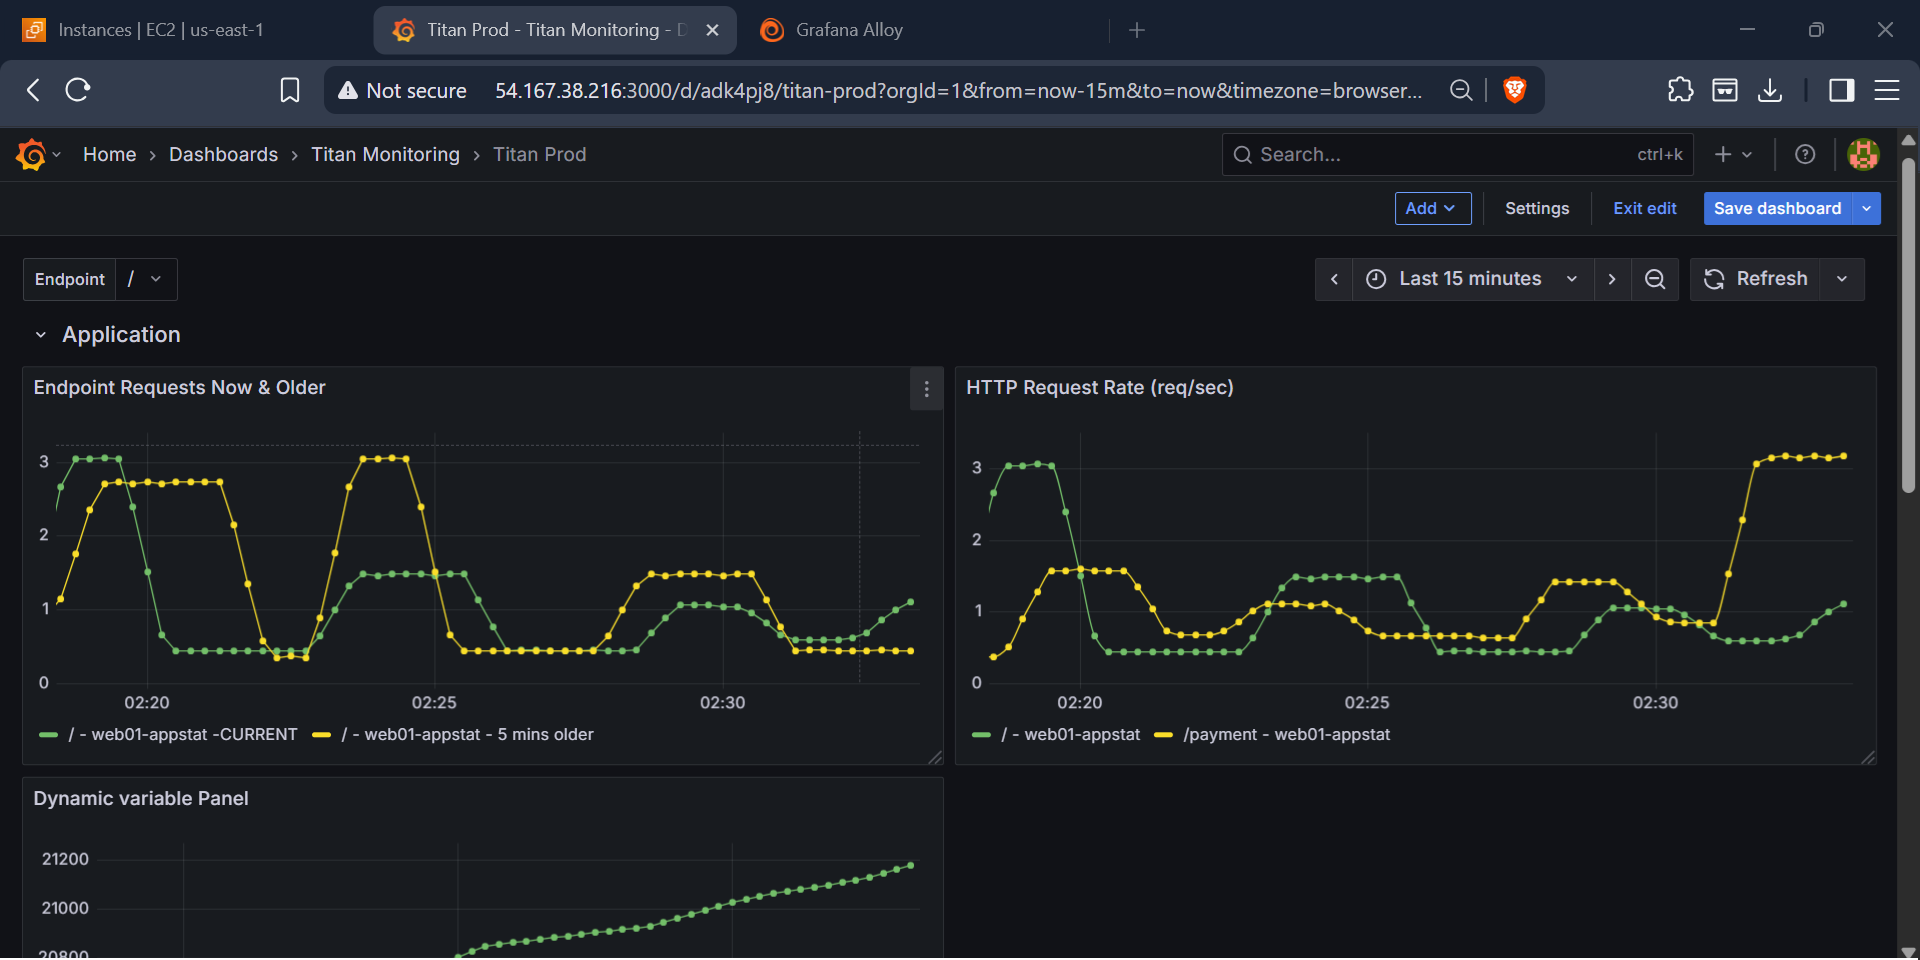
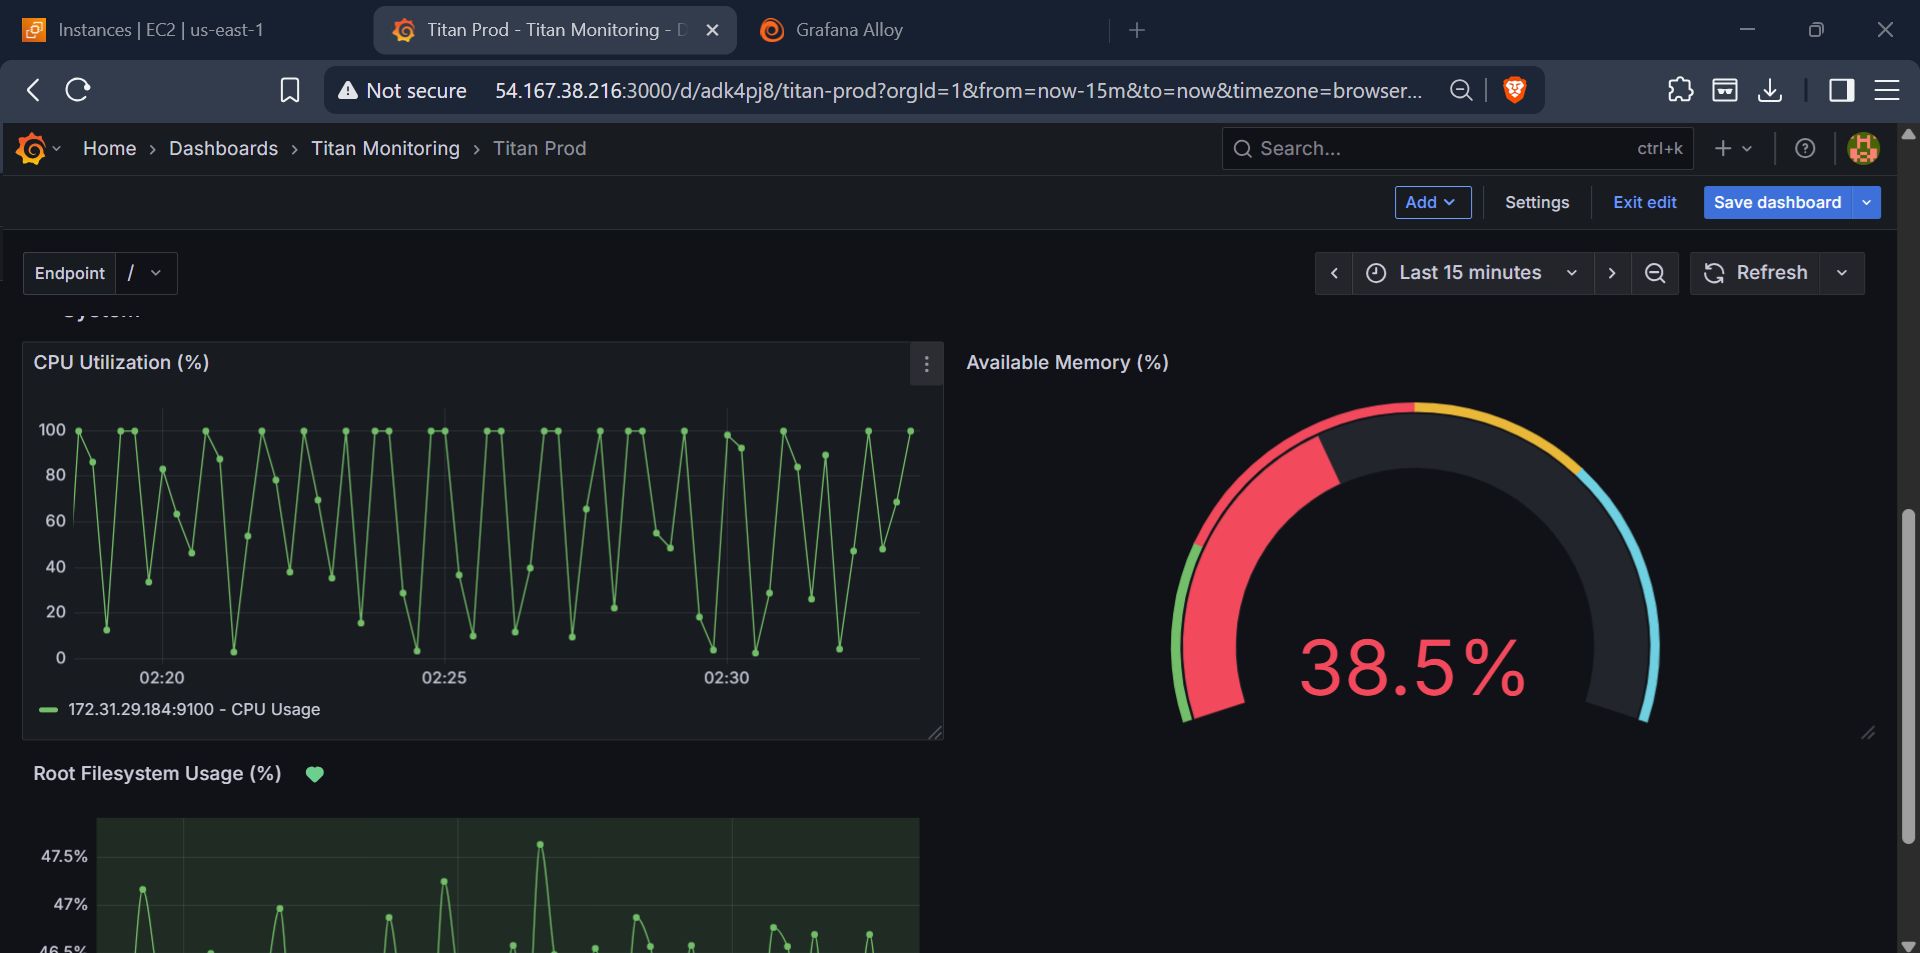
Grafana provides unified dashboards for metrics and logs.
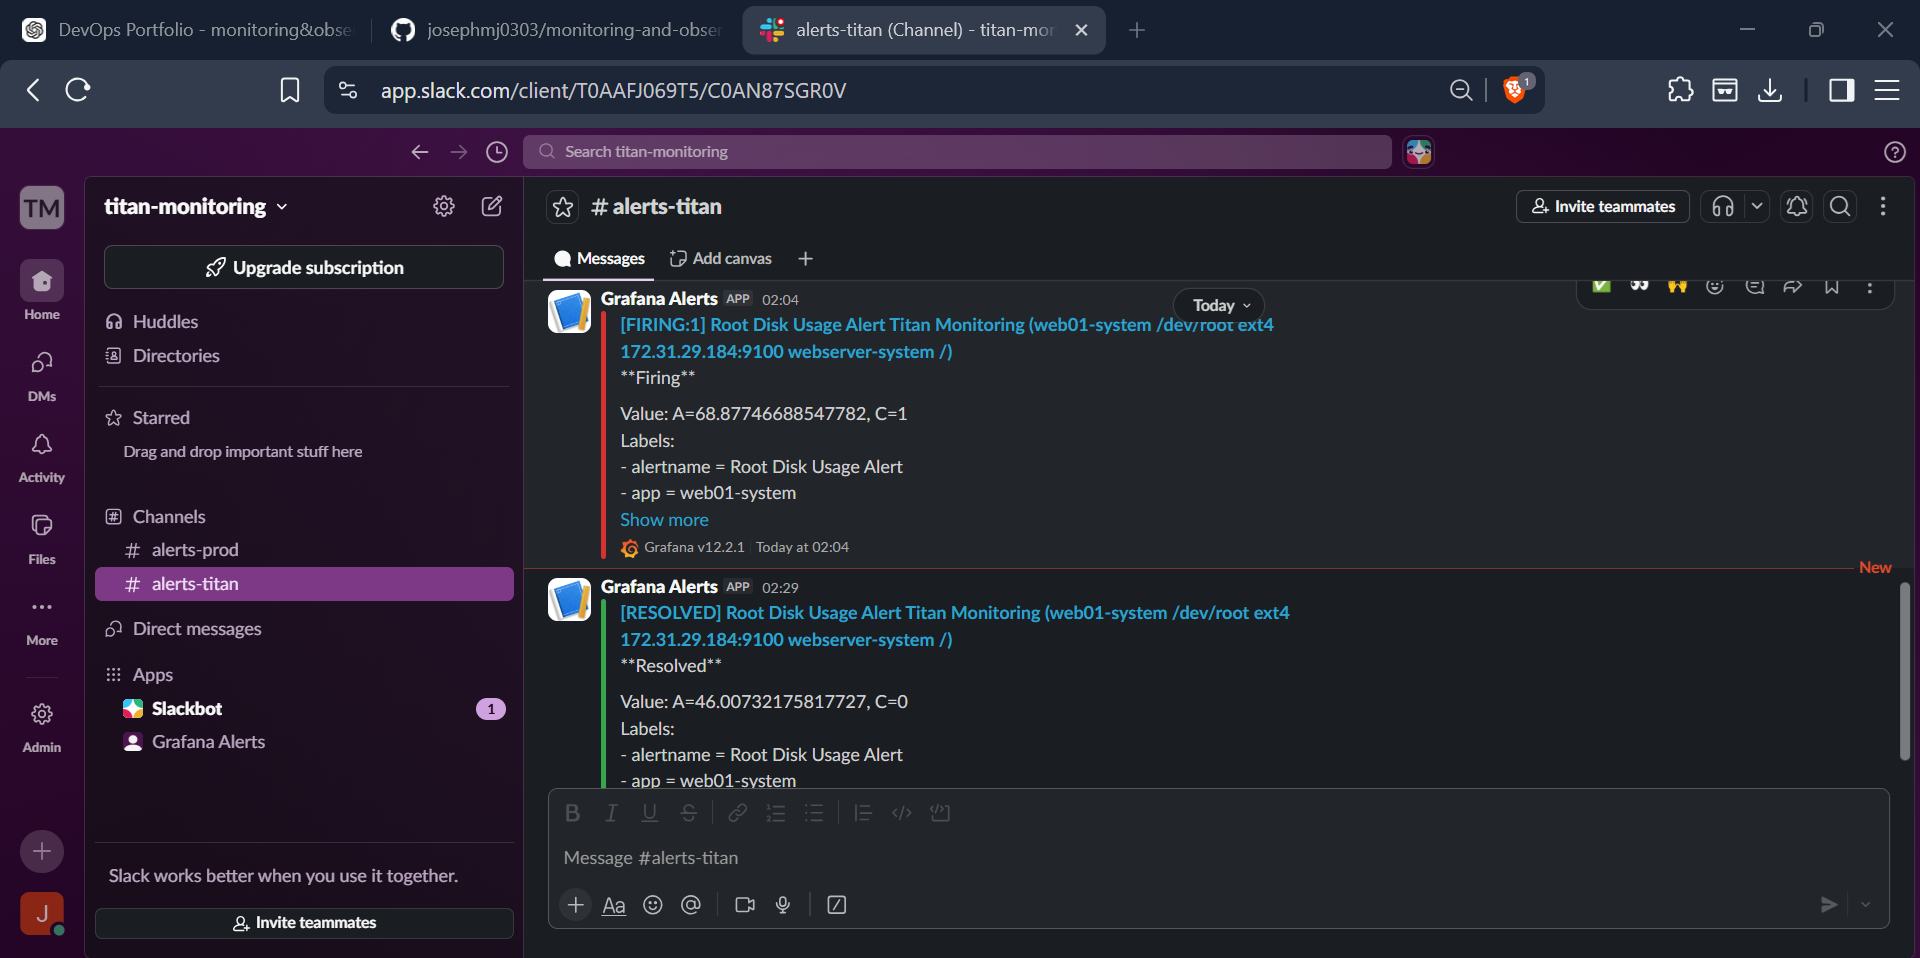
Slack receives alerts generated from monitoring rules.
Python Flask application simulates production workloads.
AWS EC2 hosts the complete observability stack.
Project Overview
This project demonstrates the implementation of a modern Monitoring and Observability Platform designed to provide end-to-end visibility into application and infrastructure health.
The platform collects metrics using Prometheus, aggregates logs using Loki, and visualizes operational data through Grafana dashboards. Grafana Alloy serves as the telemetry collection agent, while a Python Flask application generates real-world monitoring data and log events.
The solution is deployed on AWS EC2 and integrates Slack notifications for proactive alerting, enabling rapid detection and response to operational issues.
The project showcases key observability concepts including metrics collection, centralized logging, dashboard visualization, alert management, and real-time monitoring workflows commonly used in production environments.
Collecting meaningful infrastructure and application metrics required careful configuration of Prometheus exporters and scrape targets across multiple services.
Designing Grafana dashboards that provided actionable insights rather than excessive data helped improve troubleshooting and operational visibility.
Configuring Alertmanager required balancing alert sensitivity to avoid excessive notifications while still detecting critical infrastructure issues.
Centralizing logs using Loki improved troubleshooting efficiency by allowing metrics and logs to be analyzed from a single observability platform.
Monitoring Kubernetes workloads provided practical experience in tracking pod health, resource utilization, application performance and cluster stability.
Implementing proactive monitoring helped identify resource bottlenecks before they affected application availability and user experience.
This project strengthened my understanding of observability practices, incident response, performance monitoring and production operations.